
Forbes Interactive Experience

Project Overview
For the 100 year anniversary of Forbes, they wanted to market the monumental occurrence through an interactive timeline. Partnering closely with Forbes BrandVoice® my team created one of the more popular posts released on the Forbes platform. The experience showcases the top market events over the last 100 years and was my team's contribution to the larger BrandVoice® campaign.
This is an account of my contribution to the project.
Goals
The goal was to design an interactive infographic for desktop and mobile that would receive ample engagement. The design would be cohesive with the additional static infographics within the BrandVoice® campaign, and use visual communication to clearly convey top market events of the last 100 years.
My Role
My role was to develop the Visual Design of the interactive infographic and work closely with the development team to determine functionality. This meant establishing a fitting color scheme, adapting an icon illustration style, and working through limitations with our developers. In addition, I produced all visual assets and created the working prototypes.
art Direction
To start we needed to filter our approach through the provided brand guidelines. The design needed to be cohesive with additional infographics in the campaign, but we had some room to make this piece stand apart. To simplify, but still tie back to the original campaign, I chose a few colors from the palette and used yellow for points of focus.

Iconography
I created icons to visually communicate each market event in the interactive design. Each icon was designed to animate as the user scrolls through the experience.
Functionality
As you scroll through the stock market milestones a bar animates horizontally across the screen which gives the user incentive to keep scrolling and fill the entire graph. This minimized the required number of actions for the user and allowed for better ease of use.
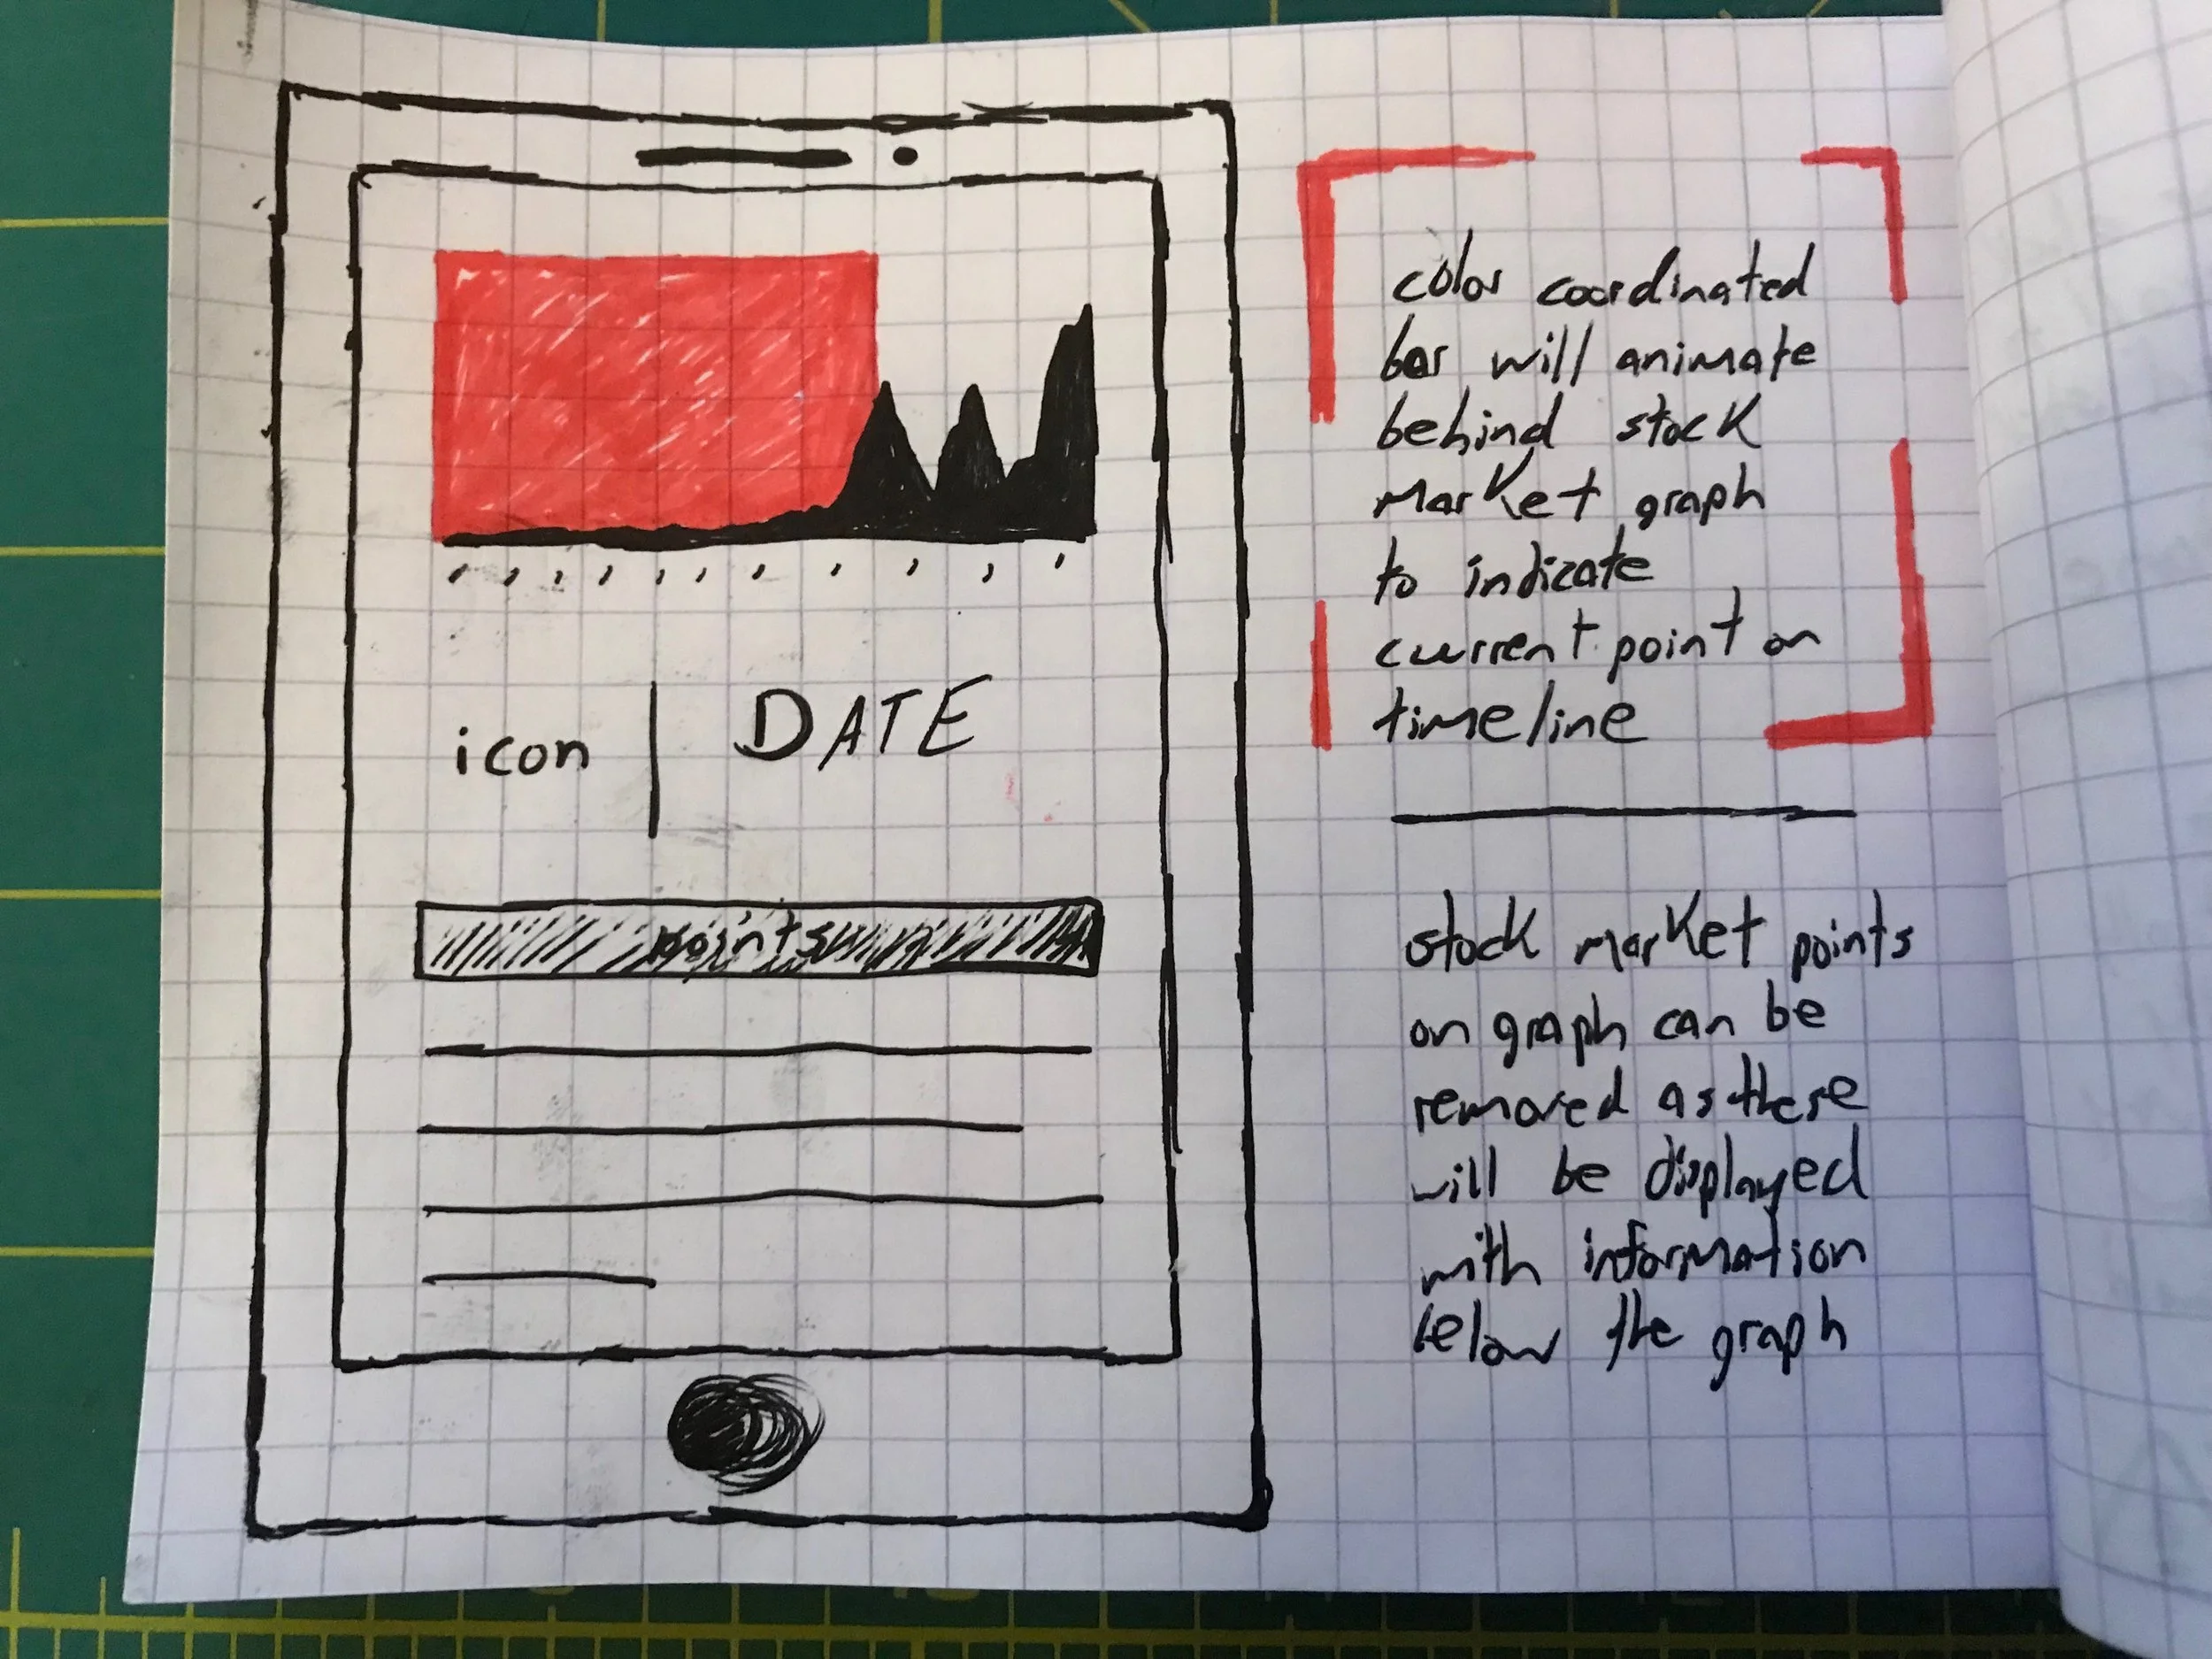
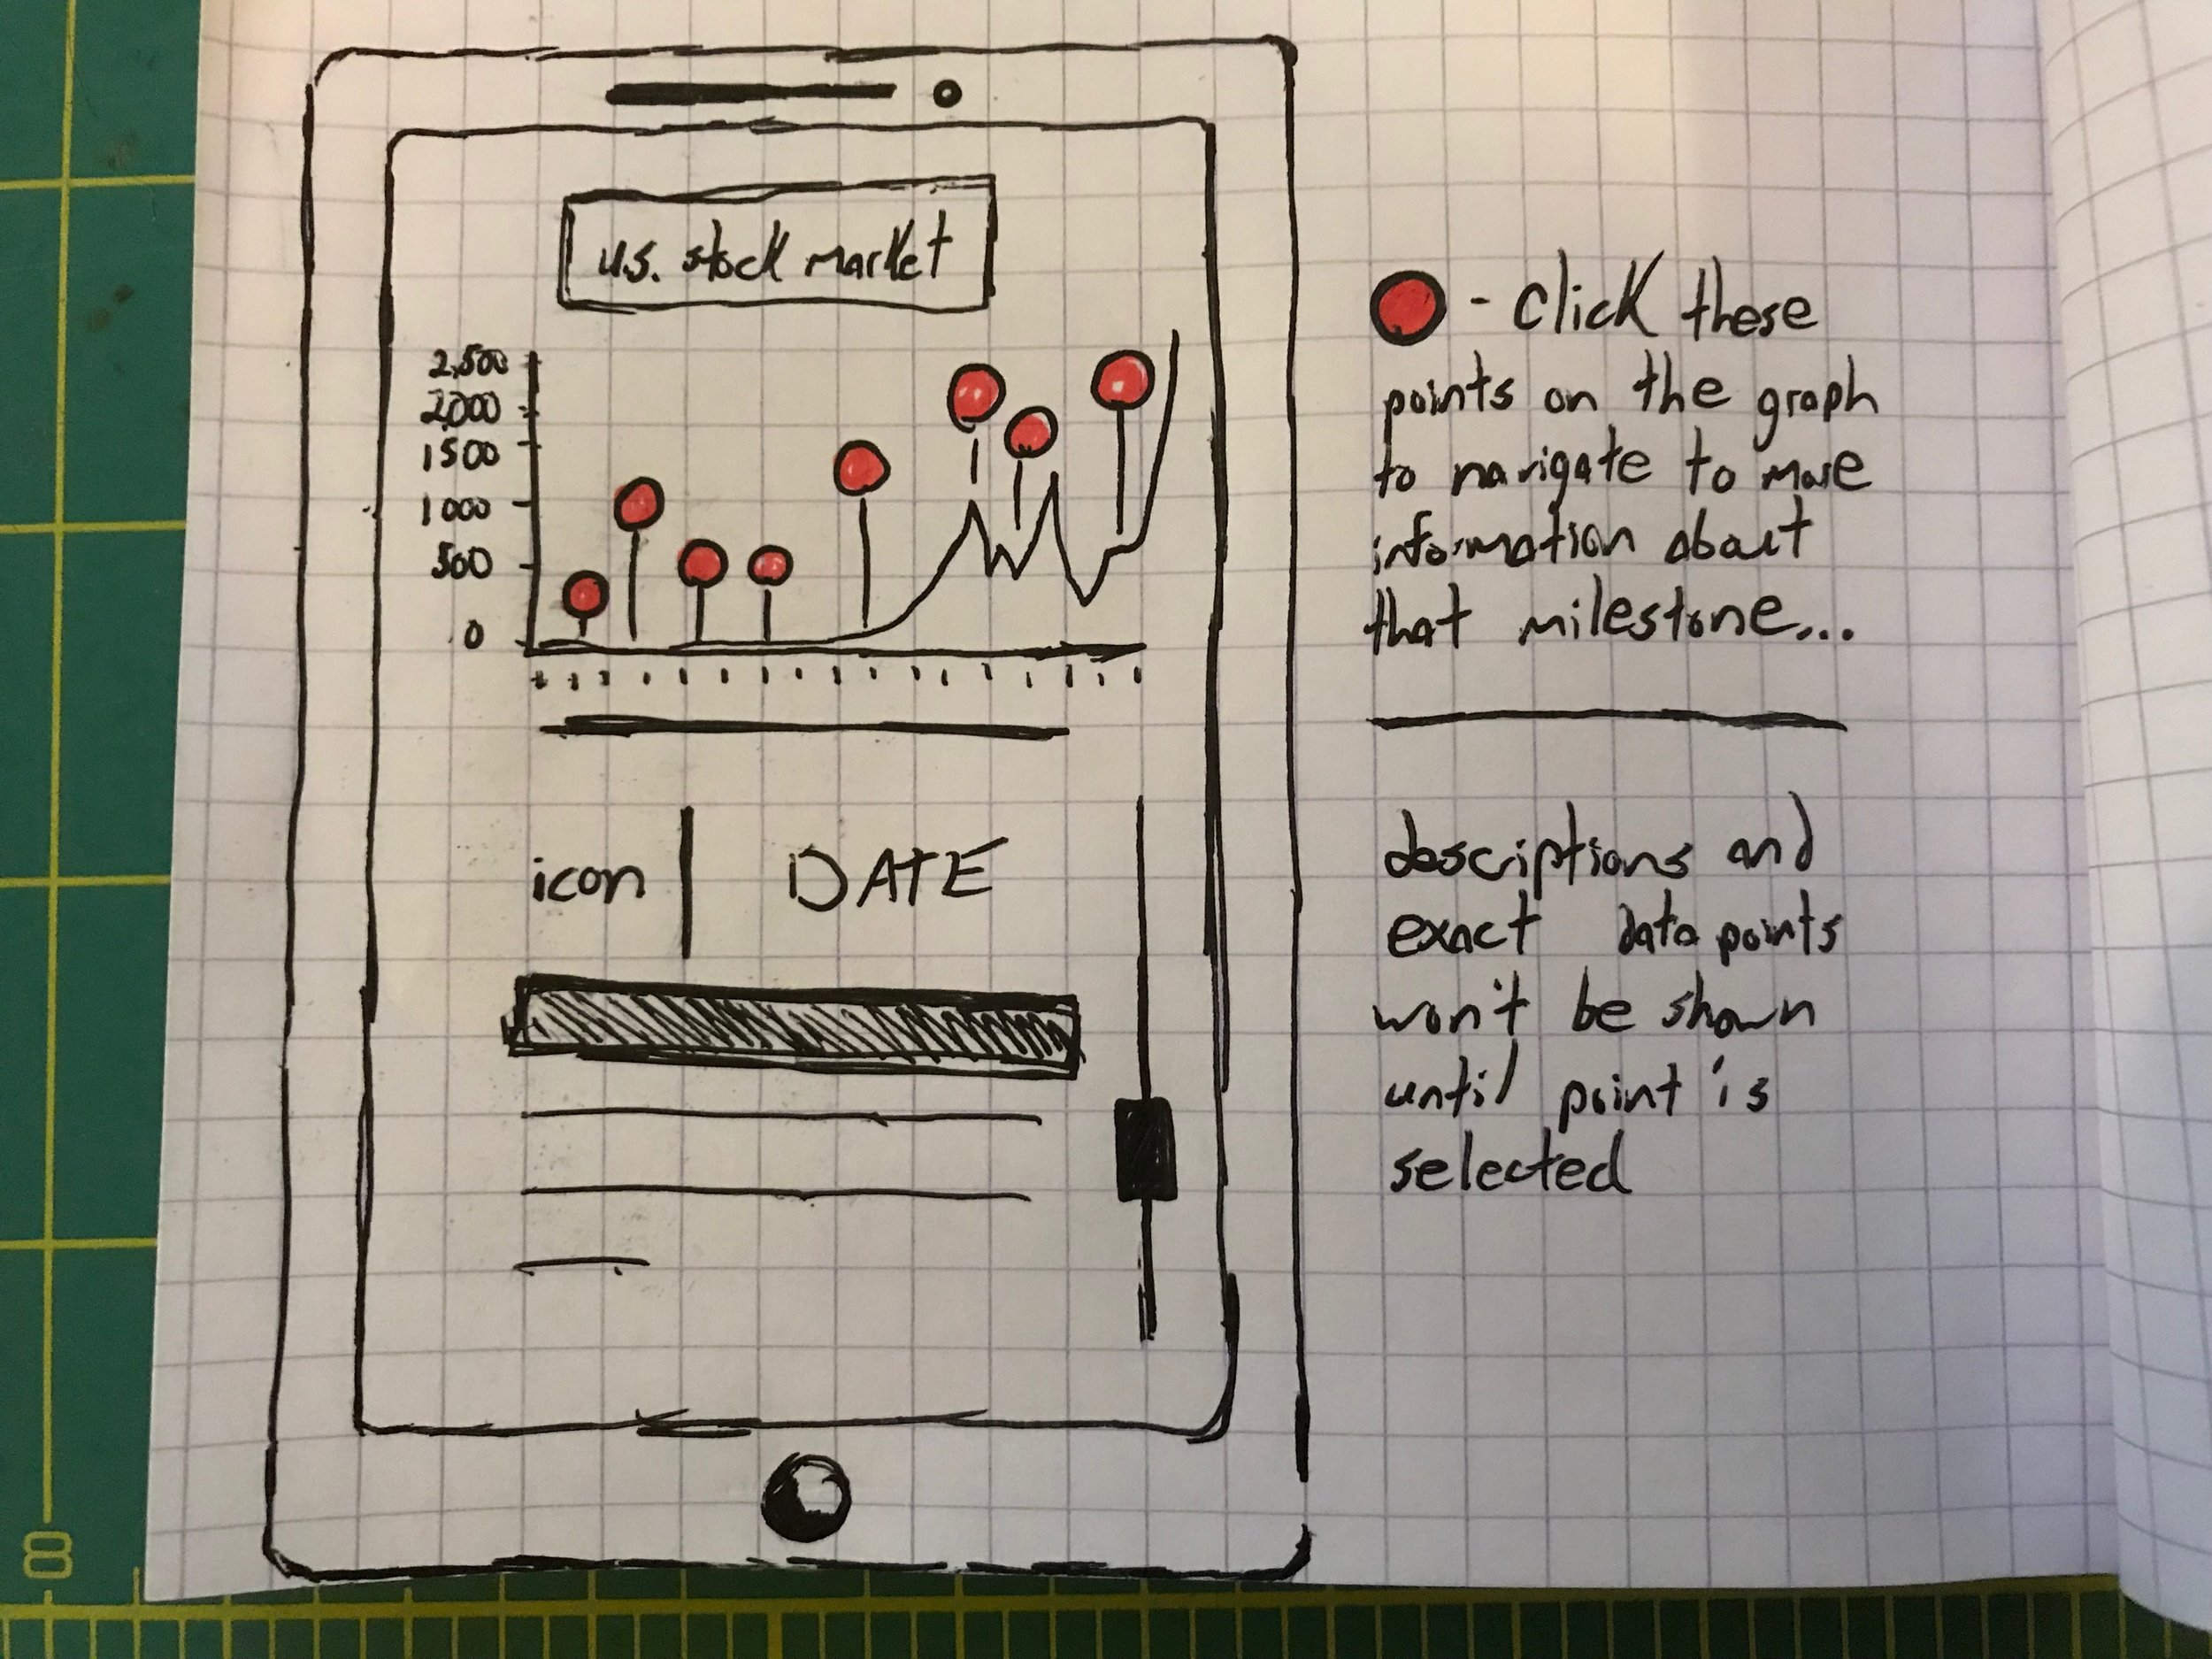
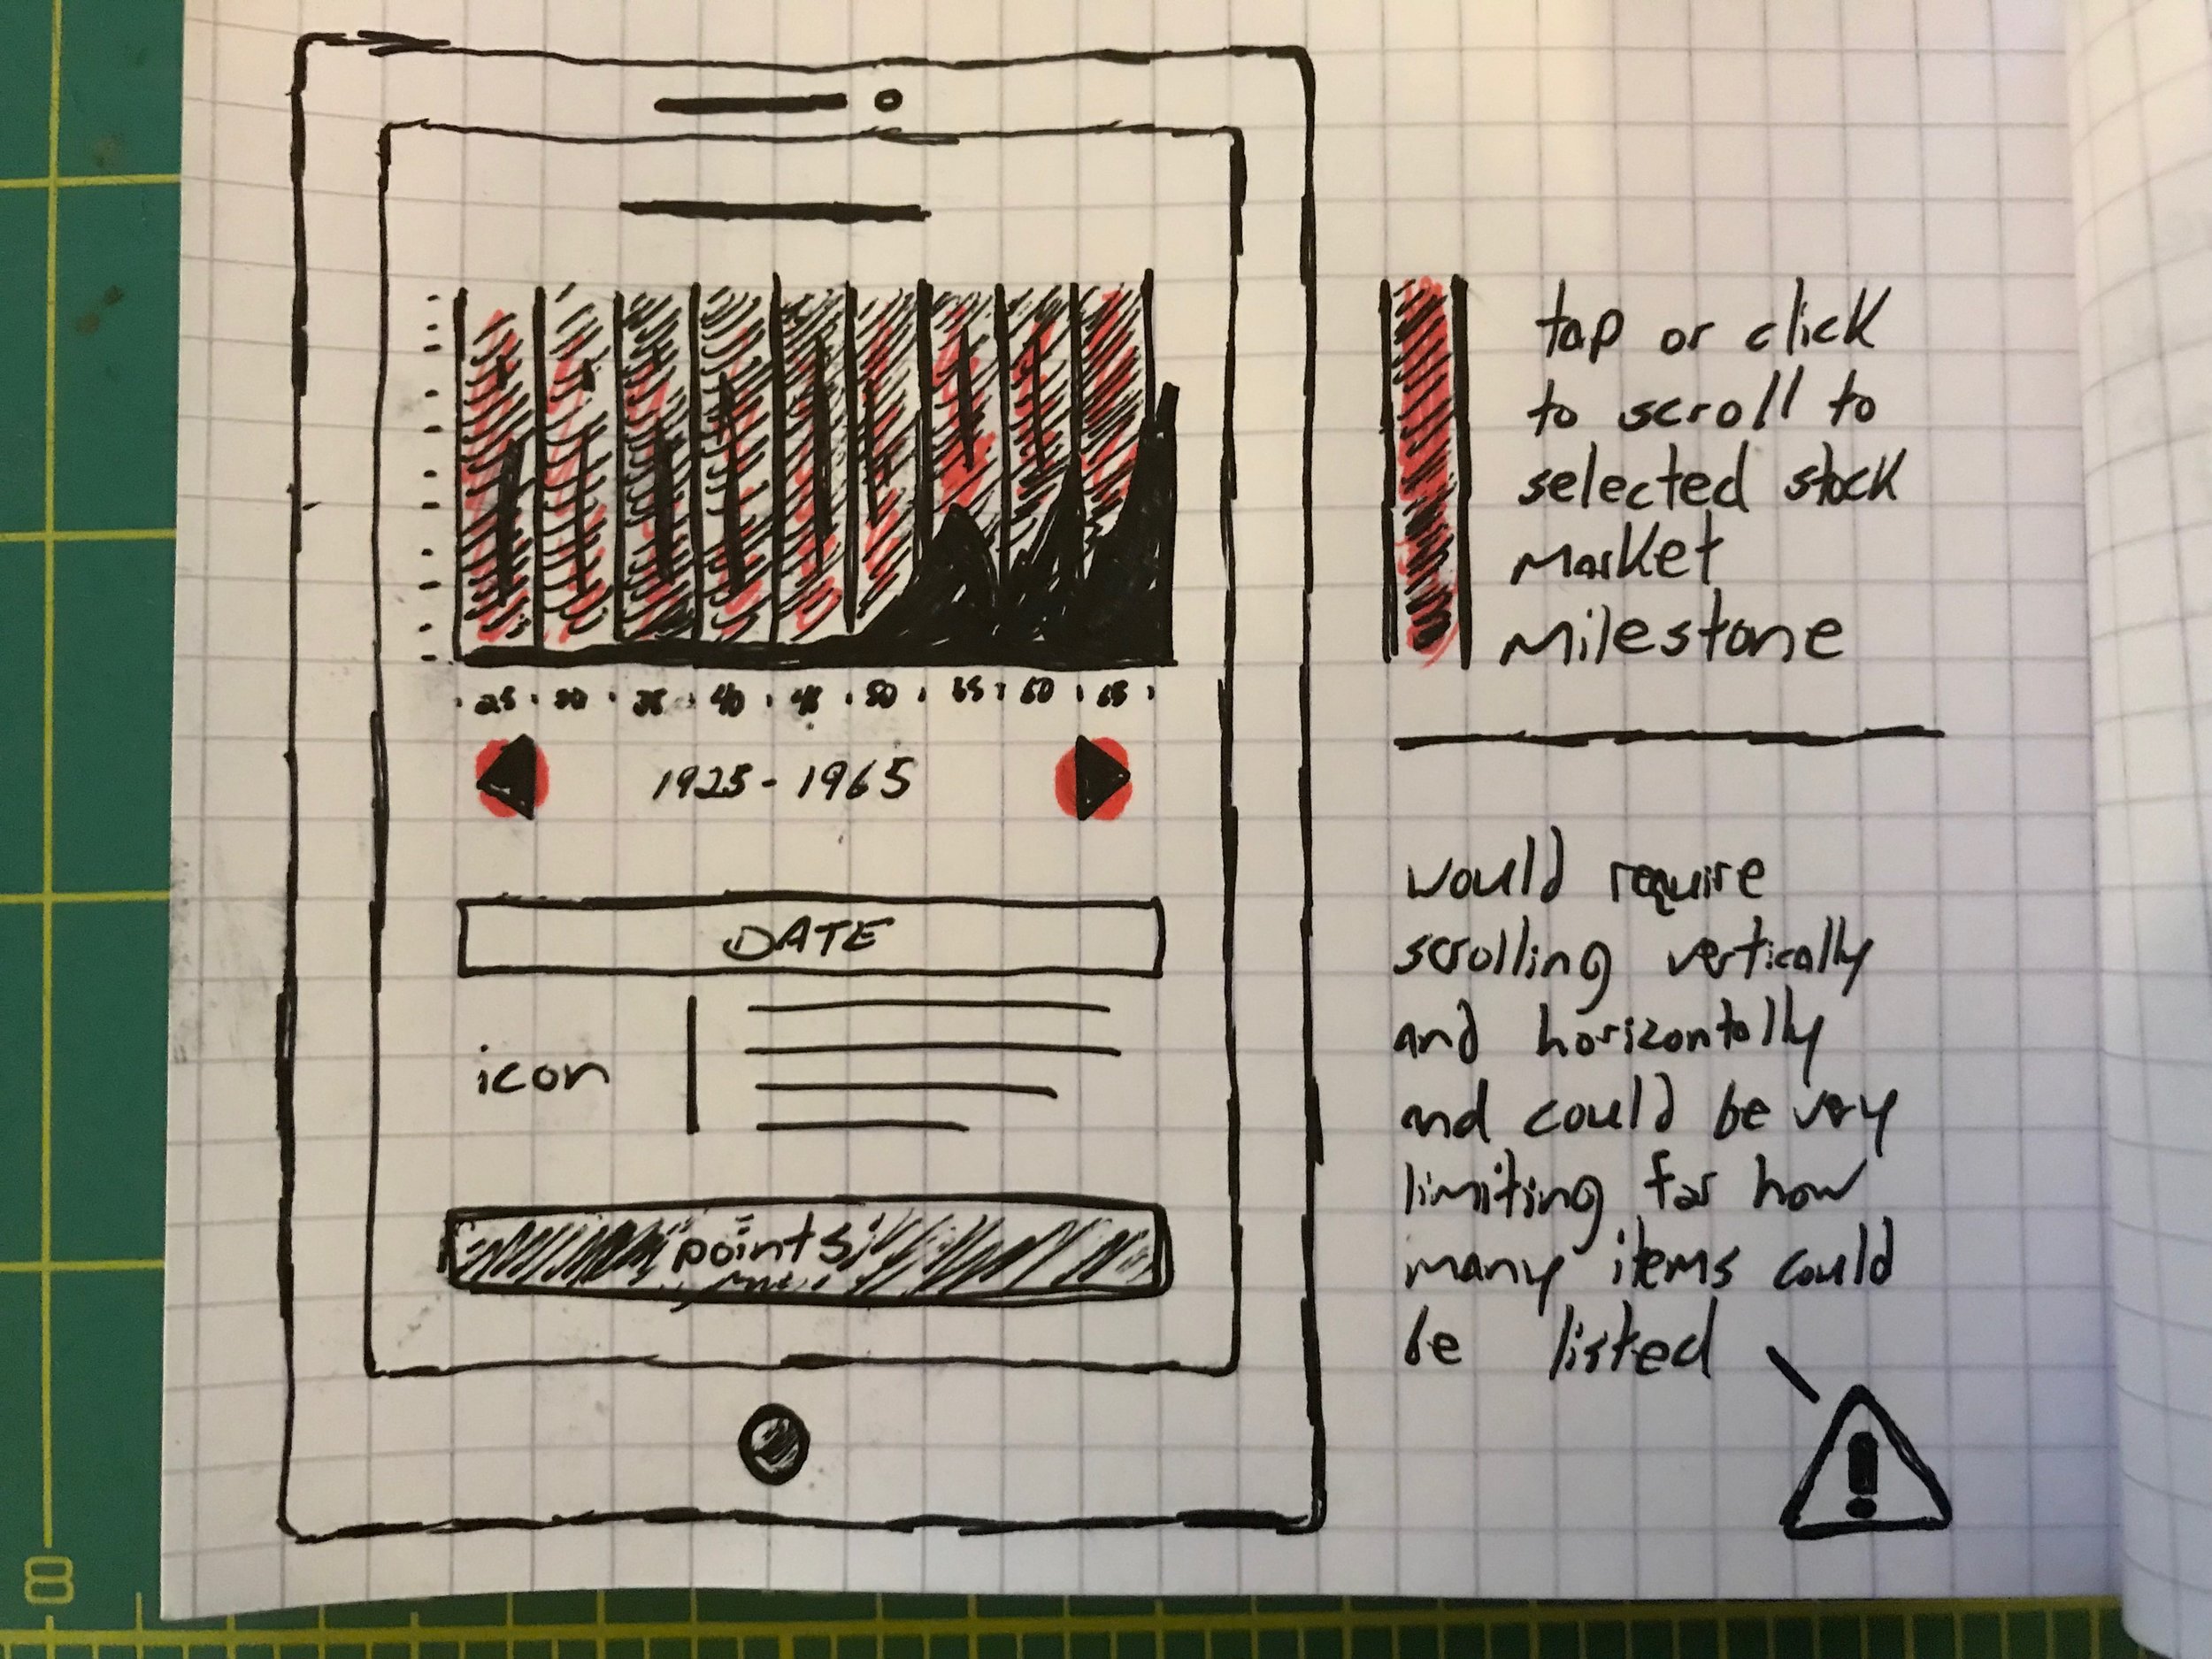
Wireframe
I used Adobe Illustrator to build the wireframe and establish the 12 column layout. Both mobile and desktop versions needed approval at the wireframe stage before we could move forward with production. The initial concept was received very well and just a few minor adjustments were made in the final design.

Prototype
I used InVision to build out a working prototype to demonstrate the functionality of the design. Both desktop and mobile versions were created for the client to review.


Results
To date, the interactive experience has received hundreds of thousands views and continues to receive steady engagement from both mobile and desktop.
